Open the same market on two platforms and you may notice that the prices don’t quite match.
Sometimes the difference is in the spread. Sometimes a candle has a longer wick, a daily close is different or one chart reaches a level that another does not.
Why do brokers show different prices if they are quoting the same market?
The answer starts with what the price represents, where it comes from and how it reaches your screen.
In retail OTC forex and CFDs, you should not assume that every broker displays an identical price stream. But a difference also deserves more explanation than simply saying, “That’s how the market works.”
As a trader and broker, I think the useful approach is to establish exactly what is being compared before drawing a conclusion.
First, check whether it is the same product
A familiar market name does not establish that two instruments are identical.
A cash index, an index futures contract and a broker’s index CFD can refer to the same underlying market while representing different products.
For example, IG’s published index CFD details explain that its cash contracts are undated transactions designed to replicate the underlying cash index, with interest and dividend adjustments. Those terms differ from a dated futures contract. Source: IG’s index CFD specifications.
Before comparing prices, check:
- The full instrument name and symbol.
- Whether it is an exchange-traded product or an OTC contract.
- Whether it is cash-based, dated or linked to a particular futures contract.
- Its trading hours and pricing methodology.
The same applies to Gold or currencies. A similar symbol is a starting point for investigation, not proof of identical contract terms.
OTC forex does not have one universal price feed
Spot foreign exchange is a decentralised, over-the-counter market. Trading takes place through dealers, direct relationships and different venues rather than one global exchange publishing a single retail order book.
The Bank for International Settlements describes an FX market with multiple execution channels, including dealer price streams, multidealer platforms and central limit order books. Source: BIS on the FX execution landscape.
That helps explain why two brokers can observe the same broad market movement without constructing identical quotes.
A useful distinction is between the market being referenced and the particular price stream available through your account.
This explanation mainly concerns OTC forex and CFDs. For an exchange-listed instrument, first check the venue, contract and market-data subscription rather than assuming the same explanation applies unchanged.
Brokers can use different pricing sources and methods
A retail quote can be derived from prices supplied by external market participants, related entities or a combination of sources, according to the provider’s arrangements.
The method used to turn those inputs into a client quote matters.
As one documented example, OANDA Europe’s execution policy describes prices derived from external participants through group entities, using an average that excludes outliers. That is its published approach—not a description of every broker. Source: OANDA Europe’s execution policy.
The implication is that “connected to liquidity providers” does not fully explain a broker’s pricing.
Which sources are available? How are their quotes selected or combined? What pricing applies to the account and requested quantity?
Two brokers may answer those questions differently. Even access to some of the same liquidity providers does not establish that the resulting retail quote must be identical.
The spread and charging structure can differ
The bid is the quoted price at which you can sell. The ask is the quoted price at which you can buy. The difference is the spread.
When comparing accounts, you also need to identify how the provider charges for trading.
An account may combine a relatively narrow spread with a separate commission. Another may incorporate more of its charge into the spread.
For example, OANDA documents a core-spread model in which the applicable spread and a separate commission together form the trading charge. Source: OANDA’s core-spread pricing explanation.
A tighter displayed spread therefore does not, by itself, establish a lower total cost.
A hypothetical comparison
Imagine these EUR/USD quotes at one reference instant:
| Quote | Broker A | Broker B |
|---|---|---|
| Bid | 1.10000 | 1.10002 |
| Ask | 1.10010 | 1.10016 |
| Spread | 1.0 pip | 1.4 pips |
| Midpoint | 1.10005 | 1.10009 |
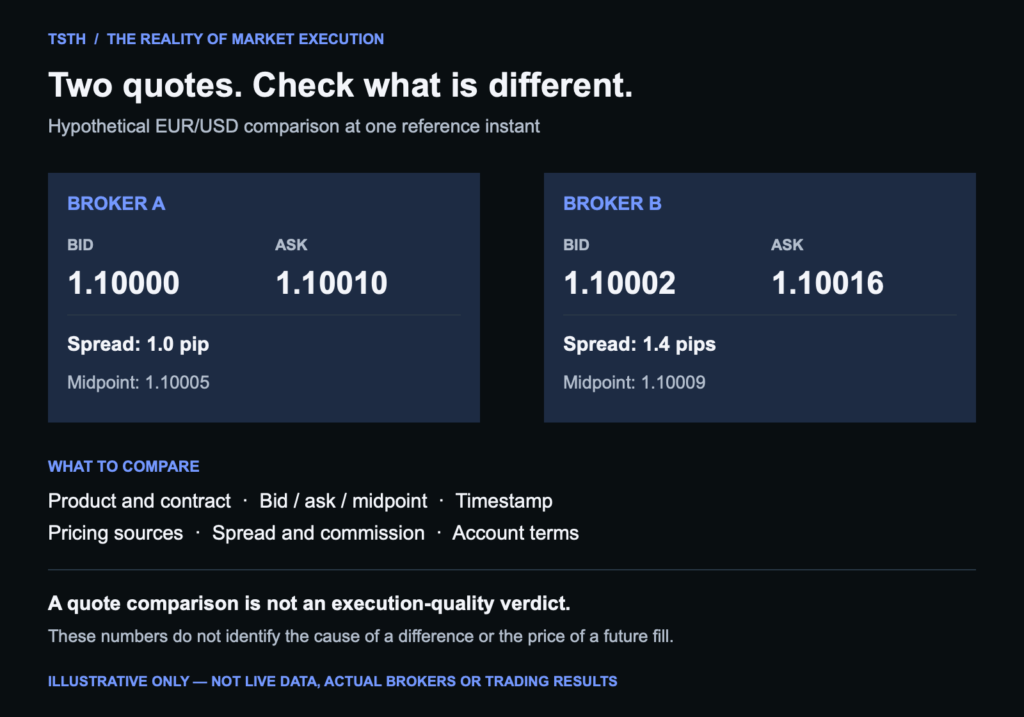
Broker B has the higher bid, but also the higher ask. A seller and a buyer would not assess those quotes in the same way.
The midpoint differs too, so this example is not simply one identical central price with a wider spread around it.
These are invented numbers for explanation only. They do not identify a real broker, establish why the quotes differ or tell us where an order would fill.
Your chart might display a different side of the price
Before investigating a small discrepancy, check whether both charts display the same thing.
A chart may use:
- Bid prices.
- Ask prices.
- Midpoint prices, calculated between bid and ask.
- Last-traded prices, where applicable to the instrument and feed.
MetaTrader 5 documents chart construction using Bid or Last prices, depending on the instrument. OANDA’s platform documentation also describes selectable bid, ask and midpoint displays. Sources: MetaTrader 5 chart settings, OANDA chart controls.
A bid candle and a midpoint candle are different measurements. Their highs and lows need not match.
This also matters when reviewing a stop. For example, OANDA Europe documents sell-stop triggers against bid quotes and buy-stop triggers against ask quotes. That can make a bid-only chart an incomplete record for reviewing a short position’s stop. Check the trigger rules for your own account. Source: OANDA Europe’s execution policy, Annex 1.
Different candle boundaries can produce different charts
Even with similar underlying price observations, candle construction can change the picture.
A daily candle groups observations within a defined period. If two feeds use different daily cut-offs, they can produce different opens, closes and candle shapes.
OANDA’s web platform, for example, provides a setting for daily candle start and end times. Its documentation treats that separately from the chart’s displayed timezone. Source: OANDA’s platform guide.
That distinction is useful: changing the timezone label on the screen does not necessarily rebuild the candles.
For a fair comparison, establish both the timestamps and the actual periods represented by the bars.
This is especially important when a strategy depends on a daily close or a defined opening range. Our opening range breakout explanation shows why the session definition belongs in the rules.
Quote timing and risk management also matter
Two screenshots taken “at the same time” may not capture synchronised quote updates.
A comparison needs sufficiently precise timestamps and an understanding of whether the displayed data is current. A screen image alone cannot show every event between a provider’s quote update and its arrival on the platform.
Dealer risk management is another part of the wider pricing picture. BIS research describes dealers using internal pricing models and proprietary liquidity pools. Its glossary defines internalisation as matching offsetting client flows rather than immediately transferring the imbalance to the interdealer market. Sources: BIS research on FX execution, BIS definition of internalisation.
However, a chart difference does not reveal a broker’s hedge or prove the presence of a particular dealing process.
Labels such as “dealing desk” or “ECN” are not substitutes for reading the pricing methodology, execution policy and account terms.
A displayed quote and a trade fill are different comparisons
Comparing quotes asks what was displayed. Comparing execution asks what happened to a specific instruction.
An order arrives at a particular time, requests a particular quantity and is handled under the applicable execution rules.
As a provider-specific example, OANDA Europe states that order size may affect pricing and that the execution-server price can differ from the price visible on the platform. Source: OANDA Europe’s execution policy.
That is why a chart comparison alone cannot establish execution quality.
Our earlier article, What Actually Happens After You Click Buy?, follows the instruction through to a fill and explains the role of available quantity and changing prices.
Where copy trading makes these differences visible
One question I encounter involves clients using copying software across brokers: why does the follower account receive a different fill from the source account?
A copied signal should not be treated as a shared execution. The follower’s instruction has its own timing, quantity and account conditions.
Depending on the software, copying may use fixed volume, proportional allocation or a risk-based calculation. Those are different instructions.
Keeping accounts within the same broker may reduce some differences where products, servers and account conditions match. It does not establish identical execution.
My practical view is to check the copier’s mapping and sizing rules alongside the broker conditions. Otherwise, a difference introduced by the copying setup can be mistaken for a pricing fault.
How to investigate a difference properly
Start with a clear question: are you comparing a quote, a candle or a completed trade?
Then collect:
- Instrument details: exact symbols, contracts and broker entities.
- Price type: bid, ask, midpoint or last-traded price.
- Timing: timestamps, timezones and candle boundaries.
- Account conditions: account type, spread and commission structure.
- Execution evidence: order references, requested quantities, fill prices and timestamps.
- Copying records, if relevant: signal time, submission time and sizing method.
Ask the broker to explain the specific event using those records.
An isolated spike, prolonged unexplained divergence or repeated execution mismatch deserves investigation. Market fragmentation is context, not a reason to dismiss a complaint.
The right question is not simply, “Why isn’t your chart identical?”
It is: “What accounts for this difference in this product, at this time, under these conditions?”
Related reading
- What Actually Happens After You Click Buy? — understand the difference between an instruction and its execution.
- Risk Management in Forex Trading — account for sizing, costs and execution uncertainty.
- The Opening Range Breakout Strategy — see why precise session and feed definitions matter when testing rules.
Oliver García is a Broker & Market Specialist at Tradeview Markets. This article is for educational and informational purposes and is not a personal investment recommendation. Trading involves risk.