The opening range breakout, usually shortened to ORB, starts with a straightforward question: after an initial period of trading, can price move beyond that range and continue in the same direction?
You mark a high and a low, wait for the range to finish forming, then look for a qualifying breakout.
The idea is simple. Turning it into a strategy requires more precision.
Which opening period? Does a wick crossing count, or must a candle close outside? Where does the stop go? How many attempts are allowed?
I’ve developed a modified ORB implementation myself. Before discussing those modifications, I want to lay out the underlying approach and a clearly defined example that readers can investigate independently.
This article explains an educational baseline. It does not disclose my complete strategy or present its results as results for the baseline.
What is an opening range?
An opening range is the highest high and lowest low recorded during a defined opening period.
For example, a trader might measure the first 15 minutes of a selected session:
- The highest price reached becomes the opening-range high.
- The lowest price reached becomes the opening-range low.
- Once the period ends, both boundaries remain fixed.
A move above the high can create a potential long setup. A move below the low can create a potential short setup.
ORB is a family of approaches rather than one universal rule set. Range durations, confirmation methods and trade management vary. Source: CMC’s explanation of opening range breakout strategies.
First, define what “opening” means
The opening period needs an exact reference.
An exchange session and a broker’s OTC price feed are different settings. For products quoted across much of the day, a trader may choose a particular session anchor rather than simply use the first candle visible on the chart.
That makes the instrument, feed, session and timezone part of the strategy specification.
For our educational Gold example, we’ll choose 09:30 New York time as a research anchor. This is a deliberate example parameter—not a claim that Gold universally opens then, and not a disclosure of my modified strategy’s schedule.
We’ll express the timezone as America/New_York, allowing the local session reference to follow daylight-saving changes rather than fixing it permanently to one UTC offset.
A baseline we can describe precisely
Here is the version proposed for readers to test.
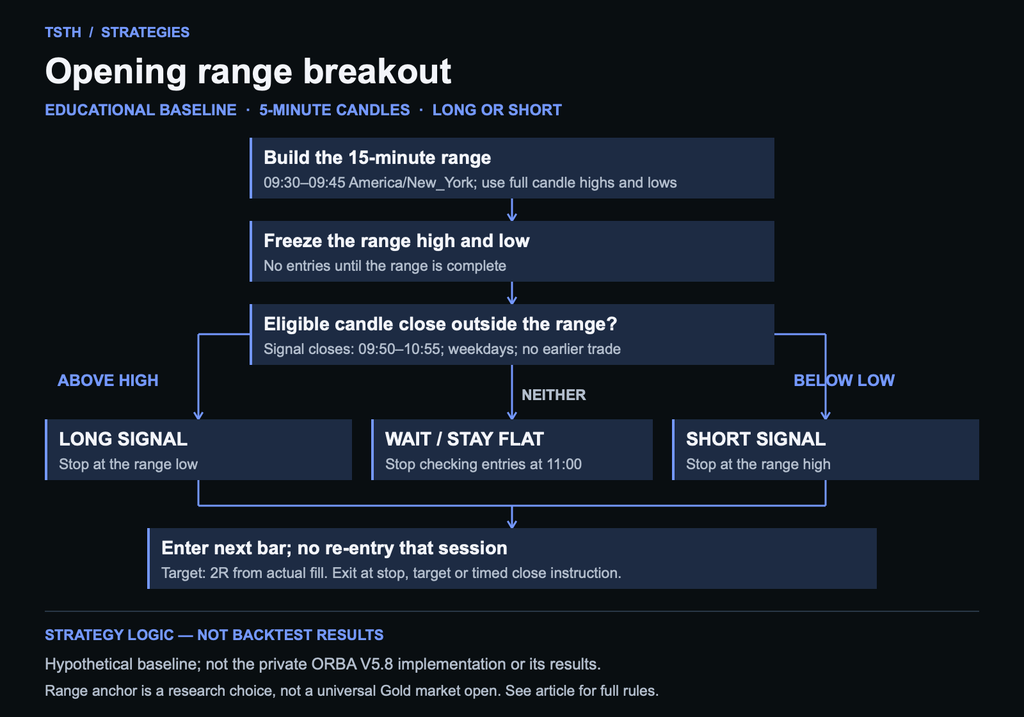
These are educational research choices, not parameters we have established as optimal.
- Reference instrument: XAUUSD using one documented broker feed consistently.
- Chart: standard five-minute candles.
- Trading days: Monday to Friday, where the required session data is available.
- Opening range: 09:30–09:45 America/New_York.
- Range construction: the full highs and lows of candles opening at 09:30, 09:35 and 09:40.
- Breakout confirmation: a completed candle closing strictly outside the range.
- Eligible signal closes: 09:50 through 10:55, inclusive.
- Entry: submit a market order after the first qualifying signal, modelling the fill at the next five-minute bar’s open, with stated slippage.
- Trade limit: one entry submission per session, with no re-entry.
- Stop: the opposite opening-range boundary.
- Target: twice the initial entry-to-stop distance, measured from the actual fill.
- Timed exit: if still holding, submit a market-close instruction when the candle ending at 15:55 completes; model its fill at the next available tick.
- Additional conditions: no retest requirement, trend filters or economic-calendar exclusions in this baseline.
Skip a session if the range is zero-width or its required candles are missing. If a modelled entry gaps to or beyond the planned stop, flag it as an invalid entry and consume that session’s attempt rather than silently changing the stop.
For an initial signal study, record results using a fixed quantity and in units of initial risk. Document what one unit means for the chosen instrument. Account-level returns require a separate, explicit capital and sizing model.
A wick crossing is not our entry signal
This baseline waits for a candle to finish.
If price briefly trades above the range high but closes back inside, there is no long signal. The same applies to a brief move below the low.
A completed close exactly on a boundary also does not qualify. It must be strictly beyond it.
For a long, the qualifying close is above the range high. For a short, it is below the range low.
This confirmation rule is a choice to investigate. We should not assume it produces better results than an intrabar trigger without comparing them.
Entry price and signal price are different
The candle close identifies the signal. It does not guarantee the entry price.
Our baseline models entry at the next bar’s open, adjusted for the specified execution assumptions. The fill may therefore differ from the signal close.
TradingView’s default strategy behaviour separates order creation from execution: an order generated after a bar closes normally fills on the next available tick, commonly the following bar’s open in historical testing. Source: TradingView’s strategy documentation.
This matters because the actual entry changes both the stop distance and the target.
Where the stop and target go
For a long position, the stop is at the opening-range low. For a short, it is at the opening-range high.
The target is 2R, where R is the initial price distance between the actual entry and stop.
Consider a hypothetical long:
- Range high: 100
- Range low: 98
- Actual entry: 100.50
- Initial stop distance: 2.50
- Target: 105.50
The range is two points wide, but the entry-to-stop distance is 2.50 points. Those are different measurements.
These numbers illustrate the calculation only. They are not actual Gold prices or trading results.
For a short, the calculation is reversed: subtract twice the stop distance from the entry to establish the target.
A 2R target describes a planned price relationship. It does not mean a winning trade will necessarily return exactly twice a losing trade after gaps, execution differences and costs.
What happens after entry?
Under this baseline, the position exits at its stop, its target or the timed closing instruction.
There are no partial exits, trailing stops or breakeven adjustments. A return inside the range does not create a separate exit instruction.
Once an entry has been submitted, there are no further attempts that session—even if the first trade loses and price later breaks the other side.
Those restrictions make this version easier to inspect. They are not claims about the best way to trade an opening range.
For testing, the stop and target must be modelled as active from entry. If both levels fall within the same historical candle, the sequence matters. Use suitable lower-timeframe evidence or explicitly report the emulator assumption; a candle’s high and low alone do not tell us which happened first.
Why a breakout can fail
A close beyond the range establishes that the condition occurred. It says nothing certain about the next move.
Price can reverse immediately. It can move partway toward the target and then stop out. It can also remain inside the range throughout the entry window, producing no trade.
The important question is what happens across a sufficiently broad sample, including losing trades and inactive sessions.
We also need to account for execution. A simulated slippage setting is a modelling choice, not a complete reconstruction of changing liquidity or spreads. TradingView documents commission, slippage and historical fill assumptions as separate parts of strategy simulation. Source: TradingView’s strategy documentation.
Before interpreting a backtest
A useful report should identify:
- The exact symbol, broker feed, timeframe and test dates.
- The session definitions and treatment of missing data.
- Capital, quantity, leverage constraints and sizing rules.
- Commission, spread and slippage assumptions.
- Entry, stop, target and timed-exit handling.
- How ambiguous intrabar sequences were resolved.
- Whether the rules were developed using the same period being evaluated.
We should examine trade count, drawdown, average trade, holding periods and performance across different periods—not only total profit.
Changing the rules after seeing disappointing results also needs documenting. Otherwise, it becomes difficult to distinguish a repeatable idea from a set of choices fitted to one historical sample.
From the basic idea to my own implementation
I’ve also developed a modified Gold ORB implementation, called ORBA V5.8.
The report accompanying this section shows one historical simulation of that version. It is not a backtest of the educational baseline described above.
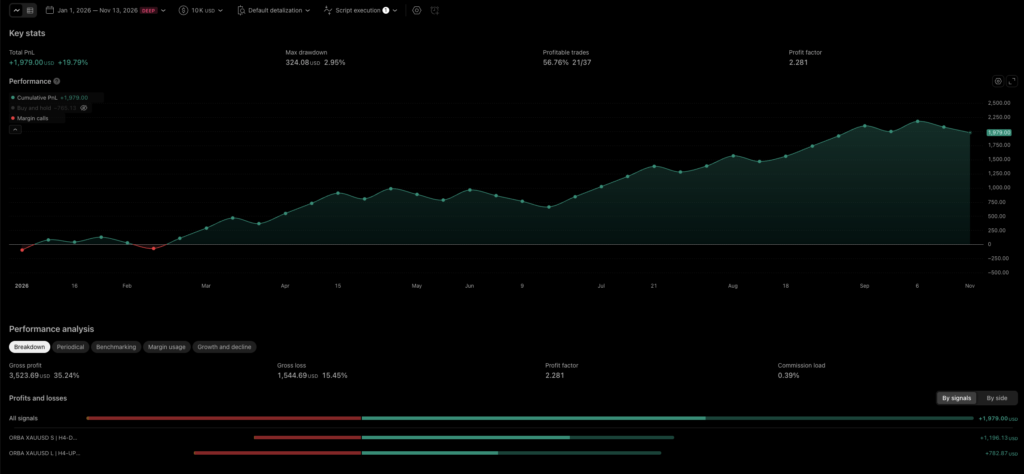
The screenshot displays a selected period of 1 January–13 November 2026, 37 completed trades and a profit factor of approximately 2.28. It also shows losing trades and drawdown. These are figures from the supplied simulation report, not a live trading record or an independently verified performance claim.
The accompanying properties show $10,000 initial capital, calculation on bar close, commission set to 0.025 per contract and slippage set to 10 ticks. These settings provide context; they do not establish that the simulation captures every cost or live execution condition.
A sample of 37 trades over less than a year is a starting point for investigation. It does not settle whether an approach will remain useful.
In the upcoming “I’m a Trader, Not a Coder” series, I’ll explain the development process and the EMA filters, thresholds, calendar exclusions and sizing choices behind my version. We’ll examine the implementation and its limitations alongside the results.
For now, the aim is to make the basic ORB logic clear enough to question, describe and test.
This article is for educational and informational purposes. The example rules are research specifications, not a recommendation to trade. Historical simulations do not represent live trading, and past performance does not guarantee future results.