A strategy doesn’t need many rules to raise some useful questions.
What exactly triggers an entry? When do you leave? Which timeframe are you using? And could someone else follow your instructions without having to guess what you meant?
That’s what interests me about Double 7s, a strategy published by Larry Connors and Cesar Alvarez in Short Term Trading Strategies That Work. Its basic structure is straightforward: buy a short-term pullback while a longer-term trend filter allows it, then exit on a recovery in closing prices. Source: the original Double 7s chapter.
I haven’t personally traded or backtested it yet. My purpose here is to understand and document the rules before asking an AI model to help turn them into a testable strategy.
This article will serve as that starting specification. Any results will come later, after we have checked what the code actually does.
The setup: daily timeframe, long only
We’ll use SPY as our reference instrument. SPY is an exchange-traded fund (ETF) that seeks to track the price and yield performance of the S&P 500 before expenses. It is a tradable product, distinct from the index itself. Source: State Street’s SPY overview.
The original strategy uses daily observations. Its filter is a 200-day moving average, and its entry and exit conditions refer to seven-day closing extremes. Source: Cesar Alvarez’s explanation.
The version discussed here is long only.
Buying opens a long position. Selling closes it. There is no instruction to open a short position when price falls below the moving average.
Being out of the market is a valid outcome of the rules.
The idea behind the rules
I read the logic as a combination of two ideas.
The longer-term filter asks whether price is above its 200-day simple moving average. The entry then looks for recent weakness within that setting.
This is a pullback approach. It does not wait for a breakout to a new high before buying.
The expectation being tested is that some short-term declines within a stronger longer-term market will recover enough to provide a useful exit.
That is a hypothesis, not a guarantee. A pullback can become a much larger decline, and a moving average cannot tell us in advance which one we are seeing.
The entry and exit rules
The published entry requires the close to be above the 200-day moving average and at a seven-day closing low. The exit is a seven-day closing high. The original description specifies buying and selling at the close. Source: the original chapter.
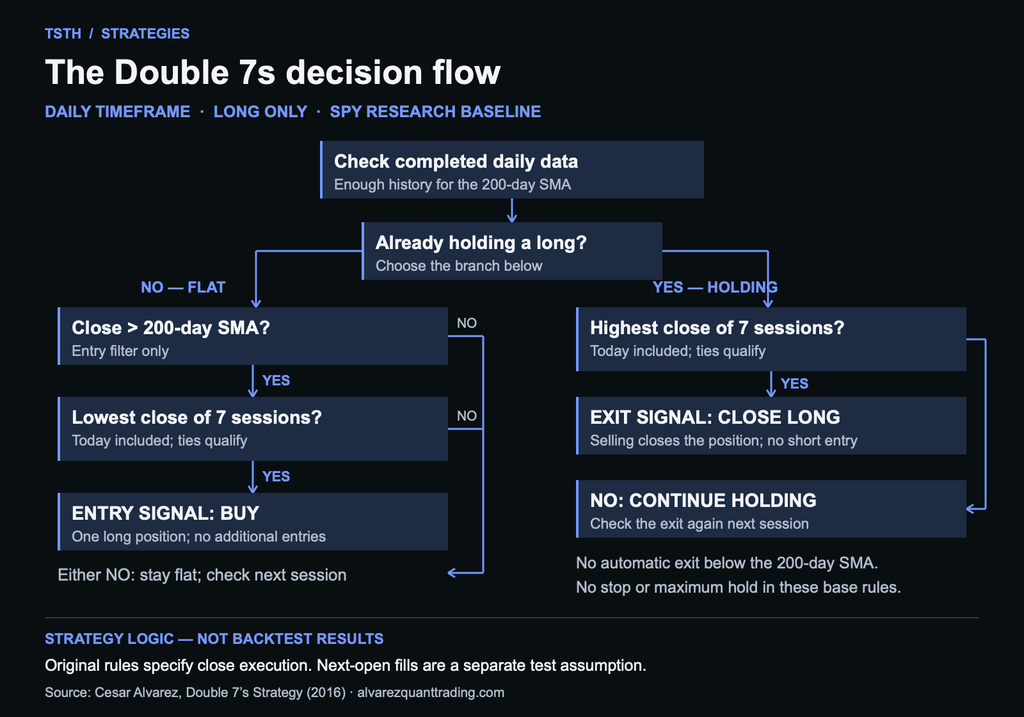
For our later implementation, we’ll make the daily calculations explicit:
- Trend filter: today’s close must be strictly above the simple average of the latest 200 daily closes.
- Entry condition: today’s close must be less than or equal to each of the previous six session closes.
- Exit condition: while holding, today’s close must be greater than or equal to each of the previous six session closes.
Today is included in each seven-session window. These are trading sessions, not calendar days.
Alvarez explicitly confirms that tied lows qualify in the original entry test. For our specification, we’ll also allow tied highs on the exit, using the corresponding greater-than-or-equal comparison. Source: Alvarez’s clarification.
We’ll use one long position at a time, with no additional entries while already holding. That is an explicit implementation choice for our research baseline.
Closing prices matter
A seven-day closing low is different from a seven-day intraday low.
Imagine these seven hypothetical closes, from oldest to newest:
105, 104, 106, 103, 102, 104, 101
Today’s close of 101 is the lowest of the seven. If the 200-day SMA is below 101, the entry conditions are satisfied.
A brief intraday move to 101 would not establish the same signal if the session subsequently closed higher.
The same distinction applies to the exit. We are comparing closing prices, not candle wicks.
These numbers illustrate the calculation only. They are not market data or backtest results.
A seven-day high does not guarantee a winning exit
The exit window rolls forward each session. It does not remain anchored to your purchase price.
For example, suppose a hypothetical trade enters at 100. Price then falls, and the latest seven closes eventually become:
92, 93, 91, 94, 93, 95, 96
The final close of 96 is the highest of that window. It satisfies the exit condition, but it remains below the entry at 100.
A recovery relative to the last few sessions can still produce a losing trade.
This is one reason I want to inspect individual trades later rather than judge the strategy from a headline win rate.
What happens if price falls below the 200-day SMA?
The moving average is an entry filter in the stated rules.
If we are flat and price is not above it, we do not enter. If we already hold a position, the base exit remains the seven-session closing high.
The listed rules contain no separate protective stop, maximum holding period or automatic exit below the moving average. That is an observation about the specification, not a recommendation to trade without risk controls.
Adding a stop or another exit would create a variation. We can investigate one, but we should report it separately so we know which version produced which trades.
Can we use a 15-minute or four-hour chart?
We can investigate adaptations, but changing the calculation timeframe changes the strategy.
A 200-period SMA calculated on a 15-minute chart averages 200 fifteen-minute bars. It is not a 200-day SMA. Likewise, seven four-hour bars are not seven trading sessions.
There are two different possibilities:
- Keep daily signals: display an intraday chart while calculating the conditions from completed daily data.
- Create an intraday variation: calculate all conditions from 15-minute or four-hour bars.
The second approach needs its own testing. We would also need to specify trading hours, bar boundaries and overnight handling.
For this article and our first implementation, the specification remains daily timeframe, long only.
The detail we cannot skip: execution timing
“Buy at the close” sounds simple until we ask when the final closing price becomes known.
A backtest can calculate a condition using a completed daily bar and assign a fill at that bar’s close. That modelling assumption does not, by itself, establish that a live order could have achieved the same transaction.
Closing auctions have order-entry rules and deadlines. A market-on-close order does not remove the need to decide when the signal is available and when the order can be submitted. Source: NYSE auction procedures.
For a later test, one clearly defined alternative is to confirm the signal after the session closes and model execution at the next session’s open. Alvarez also used next-open execution in his follow-up research. We should identify that as a different execution assumption from the original close-based version. Source: Alvarez’s follow-up.
This connects directly to a broader execution question: recognising a price and obtaining a fill at that price are separate steps.
What we need before asking AI to build it
The signal rules are now clear enough to describe without guesswork. A complete backtest still needs several decisions:
- The data source, date range and daily session definition.
- How splits and dividends are handled.
- Position size, available capital and whether leverage is permitted.
- Commission, spread and slippage assumptions.
- Signal timing and execution timing.
- Treatment of an open position at the end of the test.
We’ll also need to compare the generated trades against the written rules. Code that runs successfully can still implement the wrong idea.
After that, we can examine returns, drawdown, time in the market, holding periods and the distribution of wins and losses. A useful comparison with holding SPY should use consistent dates, capital and dividend treatment.
Why start here?
What appeals to me is the clarity of the exercise.
Double 7s gives us a manageable way to explore how a trading idea becomes a written specification, how that specification becomes code, and how we check the result.
I’m a trader, not a coder. AI may help with implementation, but I still need to understand the instructions and question the output.
That’s the next stage of this research. First, make the rules clear. Then find out what happens when we test them.
This article explains a strategy for educational purposes. It does not present a personal trading record or a new TSTH backtest. Trading involves risk, and past performance does not guarantee future results.